By Lindsay Wagner
North Carolina released its annual A-F School Performance Grades this week and they continue to reflect the clear relationship between poverty and students’ test scores.
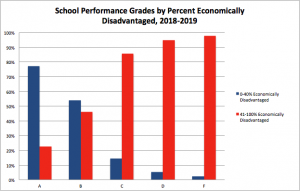
Of the 21.7% of North Carolina schools that received either a D or F in 2018-19, 95% of those schools were serving high poverty populations. That’s a pattern that has persisted since the inception of this accountability model, prompting many — including some lawmakers — to ask for both a redesign of the formula used to calculate the grades as well as targeted funding and support to schools that are not making the grade.

Source: NC Department of Public Instruction, September 5, 2019.
“If we continue to utilize this flawed school grading system without committing critical, targeted resources to our most vulnerable populations, the relationship between poverty and test scores will persist indefinitely,” said Keith Poston, Public School Forum President and Executive Director.
School-level poverty data that was initially left out of this year’s report, “Performance and Growth of North Carolina Public Schools,” demonstrate once again that A-F School Performance Grades, an accountability model first introduced in Florida by Governor Jeb Bush that came to North Carolina back in 2013, simply highlights systemic inequities that impact high poverty schools, rather than how effective those schools are at educating a vulnerable population of students. A-F School Performance Grading systems now are routinely used to promote school choice and privatization efforts.
Eighty percent of North Carolina’s school grades reflect student achievement on standardized tests on one given day, and just 20 percent reflect students’ progress on those tests over the course of the school year. Critics of this measure say it fails to sufficiently account for the academic growth that good schools help students achieve, and does not take into consideration the challenges that schools serving a high number of poor students face.
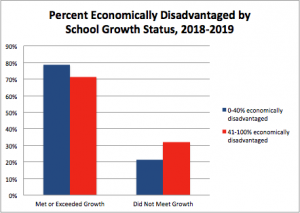
Just looking at academic growth from this year’s data, one can more clearly see that while disparities do exist between academic outcomes for high poverty schools and those schools serving more affluent student populations, those disparities are less pronounced. Of schools with high concentrations (41% or more) of students who are economically disadvantaged, 71% met or exceeded growth, compared with 79% of schools serving fewer students in poverty.

Source: NC Department of Public Instruction, September 5, 2019.
When school grades were first introduced in North Carolina, they were touted as an accountability model that would do a better job of helping the public understand how their local public schools were performing.
But in addition to the flawed formula behind the grades, there was nothing put in legislation by lawmakers to ensure that schools that were found to be struggling would receive the state funds and resources needed to help them improve. In fact, the NC Department of Public Instruction’s low-performing schools support division that had demonstrated success in school turnaround efforts was gutted.
And over the past ten-plus years, other support for low-performing schools that came in the wake of a Leandro court ruling and was further shored up with short-term federal Race to the Top funds has dwindled dramatically thanks to the state’s pivot toward solutions like the Innovative School District, a model that has a track record of failure in other states and has, thus far, proved unsuccessful in North Carolina as well.
The Innovative School District’s inaugural year shepherding Southside-Ashpole Elementary School in Robeson County saw abysmal results. The school received an F and did not meet growth expectations—its status virtually unchanged from the year prior, when it was under the purview of Robeson County Schools.
Other notable statewide school accountability results presented this week to the NC State Board of Education:
- The state’s high school graduation rate remained nearly the same as last year, at 86.5%;
- The state’s two controversial for-profit run virtual charter schools continue to receive low marks, once again receiving D grades and not meeting growth expectations for the fourth year in a row;
- Reading proficiency scores for third graders saw slight improvement, at 56.8%, up from 55.9% last year and reading proficiency rates for students in grades 3-8 were essentially unchanged at 57%.
All of this year’s data can be found on DPI’s accountability web page.

Leave a Reply